Posts

Showing posts from September, 2023

Activity 3.1 – Human Population
Image
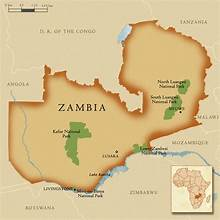
 Least Developed Country Zambia Birth Rate: 36 per 1,000 population GNI: 3,360  Death Rate: 6 per 1,000 population Population Growth: 2.9 % Life Expectancy: Male- 64 Female-67 Fertility Rate: 1990- 6.4 2020- 4.7 Most Developed Country  Canada Birth Rate: 10 per 1,000 population     GNI: 47,500 Death Rate: 8 per 1,000 population  Population growth: 0.2% Life Expectancy: Male-80 Female- 84 Fertility Rate: 1990-1.7 2020-1.5 Zambia Vs Canada After briefly going through both countries' information, it doesn't take much to tell how big of a difference there is to each category. The big difference is precisely why I chose these countries. Zambia, located in eastern Africa, is under lots of poverty. I believe the reason behind this is because of population growth. Compared to Canada, which is a much much higher developed country, their population growth is sitting at only a .2 percent whilst Zambia is at a 2.9 percent and growing. Zambia's population growth al...

Activity 2.3 – Biosphere and Interconnections

Image
 First Concept Map:  Chapter four was mainly focused on Energy. It consisted of explaining the different kinds of units used to measure it and even consisted of giving examples of it too. Not only did chapter 4 talk about measuring energy but also provided us information about how energy transforms itself to different kinds of energy and how it has various states it goes through. And the fact that during these transformations, there needs to be a balance of some sort. After reading the chapter I have a better understanding that all the transformations energy goes through, must behave according to its physical properties and that is when the first and second law of energy comes into play. So, while reding the chapter I wrote down key points that I found important and implemented them onto my concept map.  Second Concept Map  Chapter seven informed us readers about the importance of Biodiversity. In my opinion, after reading all three chapters, this one was definitely ...

Activity 2.2.1 – My daily water use

My own math based off of months July, August, and September:  Average # of gallons for July = 1,600 gallons Average # of gallons for August = 1,000 gallons Average # of gallons for September = 2,800 gallons Adding the averages up comes to equal 5,400 gallons total for these three months. Once the 5,400 gallons are divided by 3 months, we get a total of 1,800 gallons per month on average .  Three people counting myself live in my household, so if we divide the total gallons per month on average, which is 1,800 by 3 people it equals to 600 gallons per person .  Those 600 gallons per person is then divided by 30 days to see how many gallons is used per day. One those two numbers are divided we get a total of 20 gallons per day .  Name of water calculator URL My per person usage Home Water Works Water Calculator | Home Water Works (home-water-works.org) Indoor Data total: 30.4 Hunter Water ...

Activity 2.2 – Hydrosphere

Image
 Lake Mead Google Image The Drought Contingency Plan and What It Means for Arizona | Western Lands, Western Waters Google Image Federal government expected to declare first-ever water shortage at Lake Mead | KLAS (8newsnow.com) Google Maps Problem/Explanation The most extensive reservoir in the United States is quickly emptying. Lake Mead recently reached its lowest water level since it was filled in the midst 1930s. It could possibly become one of the country's most serious climate crises. I have decided to do this activity based of the Lake Mead, located in the Arizona and Neveda border. Lake Mead is very popular due to the fact that this is one of the largest reservoirs of water in the United States. Reservoirs are built to store drinkable and clean water. Lake Mead was created in the mid 1930's having a lot of water. Over the course of many years, the water level has completely changed from 1935 to 2023. It is understandable that over the course of eighty-eight years there ...

Module 1.1 - A Turning Point Event for Environmental Science

Image
 Point Of View Throughout the video in " Celebrating the Comeback of the Burning River", a variety of people getting interviewed about the burning river are speaking under the assumption that their target audience are listening through there descriptive and detailed explanations about the way the river looked during the disastrous years. Bringing the audience to kind of look at the river from their perspective. In 1969, oil in the water caused the Cuyahoga River to catch on fire, leaving the river even more horrid than before.  Purpose The purpose of the video was to inform the audience about the disastrous and terrible years of the Cuyahoga River but with those terrible years came environmental improvements. Another objective was to inform the audience about how the improvements and cleanliness impacted both communities near the water and those also living in the water. After many years of ignoring the Burning River and having many industries turn their back on it, it took o...